Global Recession – are we there yet?
Key moments:
•Business confidence index (BCI)
•Credit markets – credit spread & yield curve
•Stock markets – tax cuts & buybacks
•Government & Monetary policies
•A direct threat to the global economy - tradewar between the US and China
There are many signals indicating a potential and fairly close recession in a wide range of market indicators.
Each of the following indicators in itself is a possible threat to the economy, while the cumulative effect of them can significantly aggravate the situation on the threshold of which the world economy is today.
And while the media around the world continues to talk about economic boom, below discussed facts give a lot clearer view on the economic events taking place at the moment.
Business confidence index (BCI)
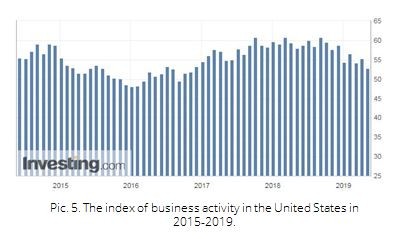
To a large extent, the state of the economy of a particular region or on a larger scale reflects the level of production. And if the peak phase is characterized by a maximum of business activity, a crisis or recession already demonstrates a decline in production volumes. This is especially pronounced in the industrial sector. While the year 2018 saw predominantly an increase in industrial production in US, the year 2019 shows only a decrease in this index.
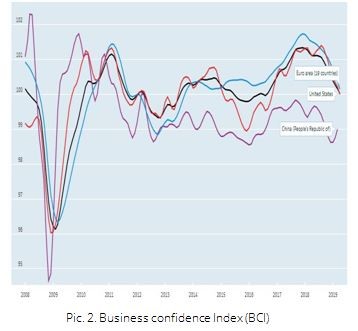
Business confidence index (BCI) displays the expectation of future events based on public opinion on the situation in production, orders, stocks of finished products in the industrial sector. It is used to monitor production growth and forecast turning points in the economy.
On the graph it is clear that in US, the EU, and on a global scale, business activity is expected to decline. The only exception is China, which probably positively assesses the prospects for the development of cooperation with the Russian Federation.
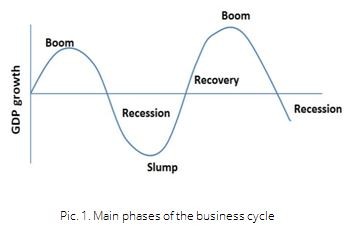
By the way, do you not find that the trajectory of the index movement resembles the schedule of business cycles (Pic. 1)?
Credit markets – credit spread & yield curve
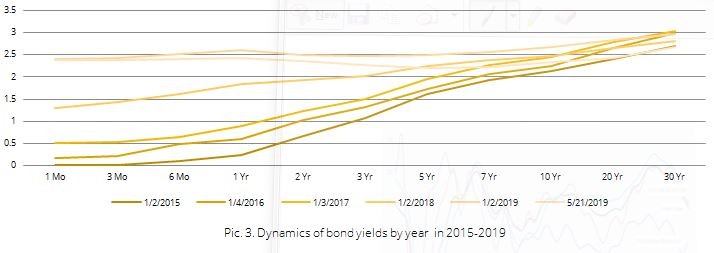
In March, the shocking news was that the yield of 3-month US government bonds coincided with the one of 10-year bonds at the level of 2.455% with a further excess, and this situation remains at the moment. A similar situation with 2-year and 5-year bonds, and some analysts consider the inversion of the “two-year plans” to be a sure sign of an impending crisis. Normally, the situation should be reversed: investments in long-term securities are more risky, therefore their profitability is higher. Yield inversion is observed for the first time since 2007, and it was this year that preceded the global financial crisis. Typically, a recession occurs with a deferred effect for six months or a year.
The graph below shows that already at the beginning of 2019, the yield on 1-year bonds was higher than the medium-term (2-7 years) yield; in May, the yield curves took clear signs of inversion.
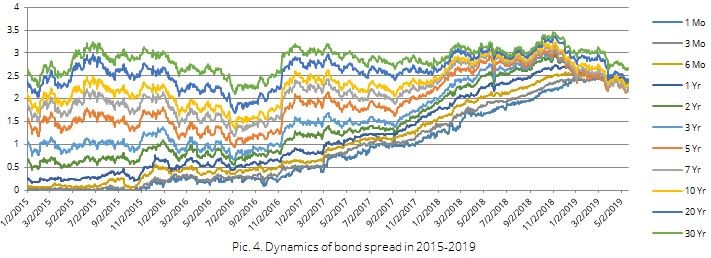
 The reduction in the spread of government bonds more clearly is presented in the chart below, where already today it is obvious that the yield of short-term bonds is higher than long-term bonds.
 In other developed countries, the situation took an even more shocking turn: at the moment, the yield on 10-year government bonds of Germany and Japan are at the level of (-0.075%) and (-0.048%), respectively. Leading central banks, including the Federal Reserve System (FRS), made a significant contribution to the rise in yields of long-term securities. And although the Fed has currently suspended further interest rate increases, the “domino effect” has been launched.
On the other hand, it was the refusal of the Fed to further increase the rate that could lead to a decline in the US government bonds’ popularity among investors. The situation was aggravated by a massive panic on the occasion of a possible weakening of the dollar and the desire of central banks to get rid of government bonds.
Undoubtedly, on the eve of the beginning of the new presidential election campaign of 2020, the recession is a “dubious gift” for the current head of the White House, from which we can expect artificial support for both the dollar and the economy as a whole. At the same time, it is difficult not to notice the trend of a decrease in the business activity index in 2019, which is one of the main indicators of the state of the economy.
Stock markets – tax cuts & buybacks
Let us now take a look on the stock markets – what are they signaling and what can we learn from them?
Incompatibility of earnings vs stock prices
As of the moment of writing this article, the earnings season has been finalized. It is now official – the S&P 500 earnings are forecasted to diminish for the first time since 2Q 2016. While the estimated decline is relatively modest (-4.2%), it would still be expected to havean impact on stock prices. And yet, we can see that S&P 500 index ispurposefully targeting to reach and probably surpass previous historical highs.
One reason for this could be the previously explained bond yields and their extremely low real return pushing investors away from debt securities. It seems that investors have their complete trust that the Fed will be ready to support growth also during an earnings slowdown.
Stock buybacks
It is not that investors alone are blindly investing in companies although their financials are getting only worse. During recent years, especially in 2018, numerous companies have executed stock buybacks as a way to invest their cash. Generally, it is done when a company’s stock is undervalued and it holds some free cash and the company decides that it could use some of the cash to repurchase back its own shares.
Don’t get me wrong, stock buybacks are neither bad nor illegal. Meanwhile, the process of buybacks often misguides the company’s investors. During a stock buyback, the number of shares outstanding is decreased by the number of shares the company repurchases. This means, that all ratios that include the number of outstanding shares, are distorted for the benefit of the company. For example, Earnings Per Share (EPS) is calculated dividing company’s earnings with the number of outstanding shares. As the divisor is now smaller, the ratio of EPS becomes larger. EPS is a widely known indicator and it is often used as one of the key factors in the decision making on whether to invest in a particular stock.
There are other worth mentioning factors that often play a role in the company’s decision of organizing a stock buyback:
•The company’s stock price rises almost always upon the announcement of a stock buyback;
•Via stock buyback, the company diminishes the amount of fundsit needs to pay in dividends;
•Ability to repurchase its own shares at a lower price in case of a short-term drop in the share price.
Stock buybacks were additionally boosted by tax cuts in the U.S. The Tax Cut and Jobs Act offered a tax “holiday” allowed companies to repatriate foreign profits at a reduced rate. While it was meant that the additional free cash would stimulate investments in long-term growth, most companies used the cash to buy back their own shares.
Government & Monetary policies
The year 2008 was also marked by a lack of understanding between the US Government and the Federal Reserve System, which is not surprising if the Head of Government is primarily a businessman whose fixed capital was created in the wake of an increase in the money supply in circulation and, as a result, price increases. The task of the Fed is to assess the long-term outlook for inflation and economic growth, and not to support the stock market in the short term. The previously mentioned 10-year-old “bullish” market accompanied the recovery phase of the economic cycle and was caused by liquidity created in the framework of QE (quantitative easing) policy to overcome the 2008 crisis, one of the main measures of which is to reduce the Fed's key rate.
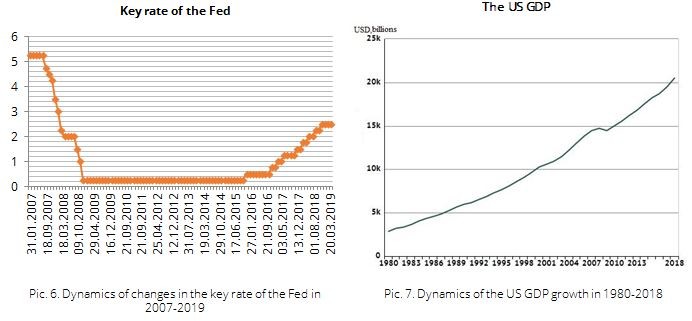 It is obvious from the graphs above that quantitative easing was successful, and already in 2010, the US GDP not only began to recover, but also confidently turned into growth. It would be logical at this phase to start a systematic increase in the key rate in order to maintain healthy inflation and adequate development of the stock market, however, it remained unchanged until almost 2016. As a result, the financial market has become significantly distorted and has generated a large number of dummy companies and speculative transactions.
A logical question arises: is Trump's value for GDP growth overvalued? In parallel with the growth of GDP, the public debt of the United States reached a record level, which in January 2019 amounted to $ 22 trillion, or 105.4% of GDP. In this case, the current situation more clearly demonstrates the slowdown in business growth, which is a signal of the beginning of a downturn in the economic cycle. Probably, the Fed had some hidden “signals” about the impending recession: in order to reset the markets and all asset classes, a systematic increase in the key rate in 2018 occurred.
At the moment, the Fed has stopped the increase in the key rate, moreover, the massive sale of government bonds in the world can resume a large-scale purchase of debt securities. It is believed that the Fed methodically prepares the economy for the next economic cycle, breaking the QE into 2 stages.
Is it possible that some information is being with held from us in order to prolong the state of euphoria from the “bull market”, “the heyday of the US economy under Trump” and diminish the panic in the markets?
By the way, the United States, thanks to the countries where the yield of government bonds is close to or even below 0, is in a winning position. Due to this policy, the US, in case of a crisis, will have an opportunity to lower the interest rate – an option that many countries won’t have.
A direct threat to the global economy - trade war between the US and China
The control shot in the current situation, not only for the US economy, but also for the world as a whole, is a new round of the US-Chinese trade war. Washington on May 10 raised from 10% to 25% duty on goods from China worth $ 200 billion a year. Beijing responded by introducing duties in the amount of 5–25% of duties on imports from the United States worth $ 60 billion. They will take effect from June 1.
By becoming strategic rivals, the United States and China are detrimental not only to their economies, but also to the world economy as well. The introduction of duties on the import of goods of a rival country will determine either a rise in prices for products, or its withdrawal from the market and a reduction in production. The next link in the chain will be the excess of demand over supply, which will already move the price of goods up in a weakened economy and lower profits. Another significant consequence of the decline in profits and production cuts is the increase in unemployment, which will affect not only the United States and China, but also other countries.
Of course, the likelihood of reaching a preliminary agreement exists, but will always be unstable due to the fundamental differences in the economic models of the two countries. The effect of any next round of relations between the United States and China may have unexpected consequences.
Of course, the goal of this article is not to terrify its readers with the approaching crisis, but to prepare you for a possibly not so distant future and help you to make the most reasonable, informative and long-term decisions. Most likely, in the run-up to the US presidential election, "the recession is postponed." However, it would be unwise to ignore such bright signals of the transition of the world economy from the peak phase to the recession phase. Considering that in conditions of a recession it is not advised to rely on investments in growing companies, investments in more stable companies that are able to pay dividends even in adverse conditions can be the best way out.
Santa Zvaigzne
Senior Financial Analyst,Macte Invest
Olesia Shemet
Financial Analyst, Macte Invest
Atgal